Building and Implementing a College Readiness Indicator System: Lessons from the First Two Years of the CRIS Initiative
The College Readiness Indicator System initiative has developed a menu of signals and supports of students’ academic progress, tenacity, and college knowledge at the student, school, and district levels.
The authors wish to thank Milbrey McLaughlin, Amy Gerstein, and Kara Dukakis for their helpful comments on previous versions of this manuscript.
More students than ever are enrolling in college after high school, but many of them are not “college-ready” (Turner 2004). College readiness (CR) refers to the level of preparation students need in order to enroll and succeed in college (Conley 2007). Many school districts have Early Warning Systems (EWS) in place to identify students at risk of dropping out of high school or of not being college-eligible by the time they finish high school (Allensworth & Easton 2007), but these tend to focus on a small set of academic measures such as course credits and grade point average (GPA). Few of these systems incorporate other aspects of CR that address the necessary skills, attitudes, and competencies needed to attend college capable of earning a degree.
 The College Readiness Indicator Systems (CRIS) initiative aims to develop and study the implementation of a system of signals and supports designed to significantly increase the number of students who graduate from high school ready to succeed in college. To achieve this goal, the John W. Gardner Center is working with four of the CRIS districts to articulate efforts to address the CR gap: Dallas Independent School District, Pittsburgh Public Schools, San Jose Unified School District, and New Visions for Public Schools in New York City.
The CRIS framework (John W. Gardner Center 2011) builds upon and enhances existing EWS in three significant ways. First, the CRIS initiative advances a menu of indicators that focus beyond high school graduation and college eligibility to target CR. These indicators concentrate on more than just students’ academic preparedness and include measures of students’ knowledge, beliefs, and attitudes necessary to successfully access college and overcome obstacles on the road to college graduation.
Second, the CRIS initiative adopts a tri-level approach, premised on the idea that an effective set of indicators generates and uses data that reflect activities, processes, and outcomes at the individual, setting (e.g., classroom or school), and system (e.g., district) levels.
Finally, the CRIS initiative supports districts to effectively use indicators by utilizing an iterative “design-build” approach that regularly incorporates feedback from key stakeholders and affords flexibility and attention to local variation in capacity, needs, and opportunities. Many districts are rich in data but have substantial limitations when it comes to actually using data to inform decisions around the goal of CR. The CRIS initiative uses a Cycle of Inquiry (COI) tool to help districts articulate what needs to be in place for the effective use of indicators, which increases the likelihood that users will see indicators as valid, locally relevant, and practical and helps districts link indicators to actions that promote student success.
THE CRIS MENU OF INDICATORS
Staff from the John W. Gardner Center for Youth and Their Communities at Stanford University selected the indicators in the CRIS menu through an extensive literature review of high school factors that predict CR. An indicator is a variable that has a consistent and predictable relationship with CR for all students. All indicators in the CRIS menu measure aspects of CR that can be influenced through actions under the purview of K–12 teachers and administrators. For example, “knowledge of financial requirements for college” was included as an indicator because research shows that students and families may have incomplete or inaccurate information about the cost of college and the types of financial aid available, and this may influence postsecondary application and enrollment (Perna 2004). Districts have the ability to address this barrier through individual counseling or schoolwide dissemination of financial information. In addition to measuring actionable indicators, districts should also collect data on contextual factors – characteristics of students and the environment that one cannot change. For example, a higher level of parental education is related to increased CR (Pascarella et al. 2004). Even though parental education is not an easily malleable factor, it may be an important contextual factor when determining the supports needed to promote students’ CR.
The CRIS menu consists of indicators measuring three key dimensions of CR:
- Academic Preparedness refers to key academic content knowledge and cognitive strategies needed to succeed in doing college-level work. Examples of indicators of academic preparedness are GPA and availability of Advanced Placement (AP) courses.
- Academic Tenacity refers to the underlying beliefs and attitudes that drive student achievement. In addition to attendance and disciplinary infractions, indicators often used as proxies for academic tenacity, other indicators include student self-discipline and the extent to which teachers press students for effort and rigor.
- College Knowledge is the knowledge base and contextual skills that enable students to successfully access and navigate college. Examples of college knowledge indicators are students’ knowledge of the financial requirements for college and high schools’ promotion of a college-going culture.
The distinction between various dimensions may blur at times, as some indicators may simultaneously capture aspects of multiple dimensions, but each dimension encompasses separate skills that can be measured by distinct indicators.
TRI-LEVEL MEASUREMENT OF COLLEGE READINESS
Another unique feature of the CRIS initiative is the tri-level approach that organizes indicators into three levels:
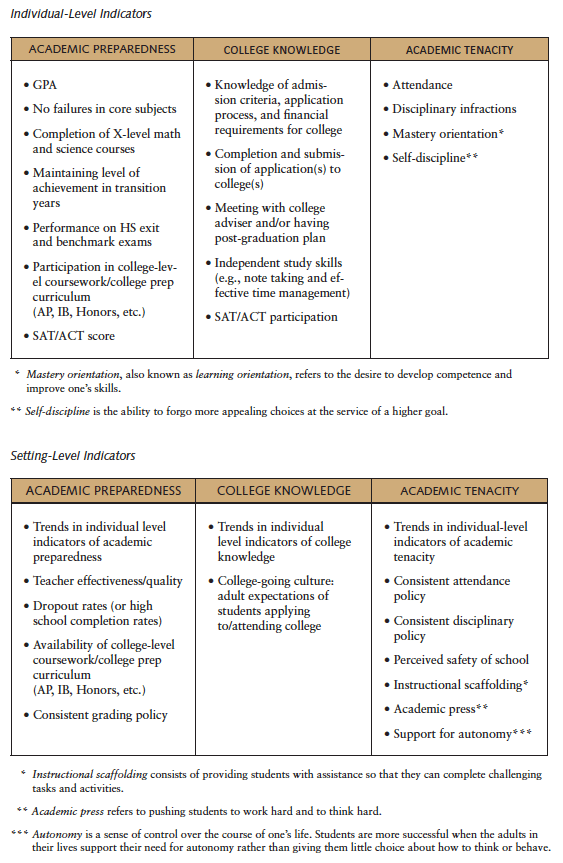
- At the individual level, indicators measure students’ personal progress toward CR. In addition to courses and credits, key individual-level indicators include knowledge about college requirements and students’ goals for learning.
- At the setting level, indicators track the resources and opportunities for students provided by a classroom or school. These include teachers’ efforts to push students to high levels of academic performance, college-going culture and resources, and instructional coherence and rigor. Setting-level indicators frequently result from aggregating student-level indicators. These types of setting-level indicators are designated in the CRIS menu as a “trend in” the corresponding individual-level indicator. For example, aggregating AP participation from the individual to the school level can identify differential patterns of CR across schools. Other setting-level indicators such as a consistent attendance policy cannot be measured at an individual level or are simply measured as either present or absent. For example, AP participation rates can be compared to the number of students with AP potential, as determined by such measures as standardized test results or teacher recommendations. This approach helps prevent capable students from missing out on important opportunities for college preparation by ensuring that each school has sufficient AP courses available, as well as a strategy in place for recruiting students into these courses and supports in place to help students succeed.
- At the system level, the focus of the indicators is on the district policies and funding infrastructures that impact the availability of CR supports, including guidance counselors, professional development for teachers, and resources to support effective data generation and use. System-level indicators are crucial in that they signal the extent to which district-level resources are in place to carry out an effective CR agenda. Due to space considerations, however, the remainder of this article focuses on individual- and setting-level indicators.
Figure 1 presents the individual and setting-level indicators in the CRIS menu organized according to the dimensions of academic preparedness, college knowledge, and academic tenacity.

THE DESIGN-BUILD APPROACH
The CRIS framework is not a “one-size-fits-all” approach that requires districts to eliminate what they have already developed; rather, it positions districts to select indicators attuned to their local context.
Selecting Indicators
By selecting one or more indicators for each “cell” (e.g., individual-level academic preparedness, setting-level college knowledge) from the CRIS menu, districts construct an indicator system that incorporates the core principles of the CR framework but also affords flexibility and attention to local variation in capacity, needs, and opportunities.
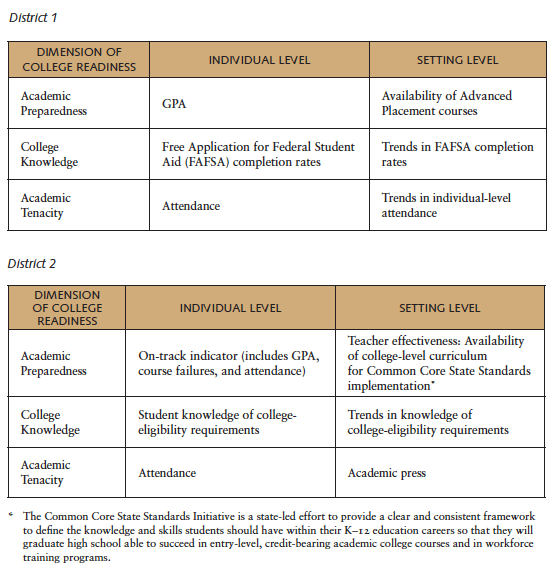
Figure 2 portrays two sample CRIS menus; though the two districts represented are hypothetical, the indicators in each cell come directly from our work with four CRIS school districts. For illustrative purposes, the menus show only one indicator per cell, but districts can (and frequently have) selected more than one indicator per cell. In the figure, District 1 selected GPA as their individual-level measure of academic preparedness. District 2 is using their “On-Track” indicator, a composite measure of GPA, course failures, and student attendance locally validated as predictive of high school graduation but also aligned with CRIS menu indicators. Each district has selected a different indicator to measure the same underlying construct of academic preparedness. Even when two districts select the same indicator, the specific ways in which the indicator signals CR will vary depending on the local context. For example, students in one district may need a cumulative GPA of 3.0 to be likely to place into college-level coursework at their local community college, whereas students in another district might require a 3.2 GPA. In addition, the effectiveness of specific interventions toward improving CR will also depend on local conditions.
Figure 2. Sample menu of individual- and setting-level indicators at District 1 and District 2

Using the Cycle of Inquiry to Design an Indicator System
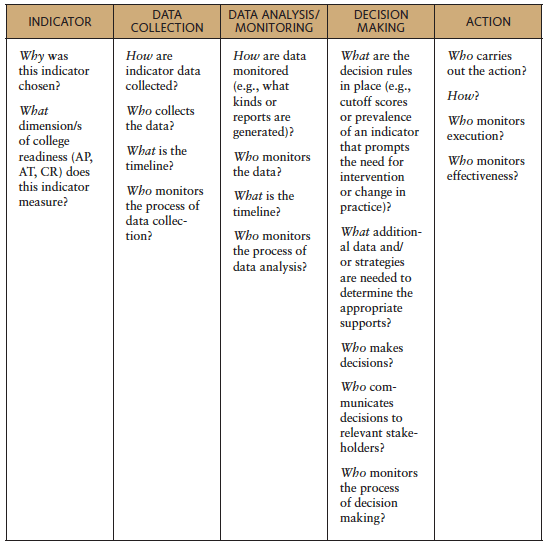
Rather than simply asking districts to collect more data, the CRIS project utilizes a Cycle of Inquiry (COI) tool (Figure 3) to help districts think through the conditions that need to be in place for effective use of their indicators. The COI walks districts through a set of questions, including: When are the data available? Who ensures that the data are entered accurately? At what threshold is action warranted? What actions are then taken? Who carries the actions out?
Figure 3. Cycle of Inquiry (COI) tool

The process of creating a COI for each indicator is simple in theory but challenging in practice. Districts typically collect data for state or other accountability purposes, but this usually results in “lagging” indicators that assess student performance only at the end of the school year. In contrast, a well-designed COI creates “leading” indicators that allow districts to engage proactively with students before they go off-track. This approach requires districts to carefully plan the purpose, timeline, and actions associated with their indicators, i.e., build the system for each indicator that will allow for its effective use. In many cases, indicators are best examined in conjunction, as one indicator by itself may not be sufficient to identify the next steps that should be taken by a teacher, school, or district.
In devising a COI, districts often need to engage their internal research department to set benchmarks to identify who needs additional support to graduate college ready, a task traditionally reserved for state or local policy-makers. CRIS also asks districts to return frequently and refine their COIs, especially after examining the strengths and weaknesses of the implementation process, which can be a time-consuming undertaking.
Engaging in the COI requires districts to deeply reflect on the meaning of their selected indicators and to make explicit the decision rules and cut scores that connect those indicators to action. The examples that follow, using two hypothetical districts, are drawn from our work at all four of the CRIS sites we work with and convey the kinds of issues and decision making that are prompted by the COI process:
Individual-Level Academic Preparedness
Prior to joining the CRIS project, District 1 was using GPA to identify students who needed support in order to finish high school “college ready.” Students with a cumulative GPA between 2.0 and 2.5 were recommended for tutoring, and students below 2.0 were provided more in-depth intervention. In the process of creating the COI, the district leaders realized that the GPA cut scores of 2.0 and 2.5 ensured that students completing high school were academically eligible to enroll in college and receive locally provided financial aid, but the cut scores were not linked to any postsecondary outcomes such as college completion rates or college-level placement rates at local community colleges. As a consequence, the district obtained National Student Clearinghouse (NSC) data, which includes the postsecondary attendance and graduation dates of high school graduates, and is now examining what level of high school GPA is associated with postsecondary completion for the district’s graduates.
Setting-Level College Knowledge
District 1 is participating in a pilot program to track students’ Free Application for Federal Student Aid (FAFSA) completion and aggregated these data to create a school-level indicator of college knowledge. The district used the data from the first year of the pilot to create a set of benchmarks for the percentage of twelfth-grade students who completed the FAFSA each month between October and April, and these benchmarks were then used to articulate FAFSA completion goals for each school. The COI designates which central office staff is alerted each month when a school is below the FAFSA targets, and a meeting is scheduled with that school’s counselors to work on outreach to students who have not yet completed their FAFSA forms. Schools that remain below the FAFSA targets throughout the year are engaged in additional conversations over the summer in order to ascertain the reasons for low completion and to promote a stronger CR focus in their school culture.
Individual-Level Academic Tenacity
District 1 chose to use attendance as an individual-level indicator of academic tenacity. Even though the district was already tracking attendance, initial conversations made clear that they had been using this as a “lagging” indicator, focusing on attendance at the end of the course semester. In addition, the district targeted students for intervention if their attendance rate was lower than the benchmark established by state policy as a minimum requirement to receive course credit. Engaging in the COI prompted the district to (a) reconsider whether attendance data should be examined daily, weekly, or monthly instead of once per semester, to allow for timely intervention; (b) make decisions as to when to measure attendance – missing all day, any period, or first and last period – as well as how many days a student could miss before being flagged; and (c) revisit the cut-off attendance rate to determine whether it constitutes the optimal benchmark based on their local context. Engaging in the COI process prompted this district to give careful consideration to the timing of the data collection and the optimal cut-off scores in order to ensure prompt intervention with the largest number of students within the constraints of the resources available.
Setting-Level Academic Tenacity
District 1 selected trends in individual-student attendance as a setting-level indicator of academic tenacity. In addition to trends in attendance, District 2 was also initially interested in tracking trends in individual student self-discipline – the extent to which students are able to forgo more appealing choices at the service of their academic goals. After some brainstorming, the decision was made to pilot instead one of the Tripod Project surveys (Bill & Melinda Gates Foundation 2010), which measure academic press, or the extent to which teachers press students for effort, perseverance, and rigor. This decision was based on the perception that teacher academic press was more actionable (e.g., through professional development) than were trends in student self-discipline. Another consideration was that the district was already administering the Tripod survey, and therefore the data on academic press was already available.
These examples show how the COI serves an important function: helping districts to think through matters of timely and efficient data collection and analysis and make decisions that will link the data to early intervention and availability of resources (e.g., funds, effort, time) required for implementation. Care must be taken to identify goals that are feasible, given the workload of the parties responsible for utilizing and acting on the indicators.Engaging in the COI process also allows districts to foresee potential challenges and bottlenecks, including human resistance to change and internal politics, and to take proactive steps to handle those effectively.
LESSONS AND OPPORTUNITIES
Constructing and implementing a CRIS requires districts to undertake a number of technical, organizational, and political challenges. The first two years of this work have produced valuable lessons and helped identify key factors that influence the speed and depth at which districts can build their CRIS.
- Cross-departmental buy-in: A comprehensive CRIS will require input from many district stakeholders: district leadership for approval of a strategic plan that promotes the use of indicators; research departments to develop cut scores that signal CR; the IT department to effectively share data; principals, teachers, and other support services for implementation and intervention; and others. Involving these various stakeholders is needed to ensure the necessary cross-departmental buy-in required for effective implementation. The resources required to bring together these representatives can be substantial, and the process can potentially be challenging to staff who are being assigned new and unfamiliar roles and responsibilities.
- Staff turnover: Turnover of district staff and leadership has been particularly high in the large, urban districts participating in the project. Three of the four partner districts experienced superintendent turnover, the loss of the district’s CRIS leader, or both. This turnover has resulted in ever-changing CRIS teams and, in some cases, loss of advocacy for the project, significantly blunting momentum. Having a large, cross-disciplinary team helps mitigate this issue, but strong leadership is required to advocate for the importance and continuity of the CR work.
- Resource capacity: Developing, implementing, and evaluating indicators requires considerable capacity, including: the staff needed to effectively support students identified as off-track; the ability to address the logistical difficulties associated with collecting indicator data, especially when it comes to student self-report of teachers’ classroom practices; and the research capacity required in validating CR indicators. An effective CRIS will link indicators to specific measures of CR, but many districts do not have access to individual-level data on the postsecondary outcomes of their students. The necessary resources (time, human capital, and financial) need to be in place to ensure access to postsecondary data, the development of the COIs, and subsequent evaluation of interventions and supports.
- Turning indicators into action: The process of identifying indicators and collecting data is much more straightforward than deciding how to use the resulting data. To effectively use indicators, it is important to know what types of services are available for “off-track” students, determine who accesses these services, and assess how well these various interventions impact the intended outcomes. Districts rarely have sufficient capacity to engage deeply in this type of inquiry. To complicate matters, each school tends to offer a unique set of supports based on the priorities and resourcefulness of its leadership and on local partnerships. In addition to raising serious equity concerns, this also leaves teachers, counselors, and others with lots of data about which students need help, but little information on how to successfully intervene with students on a consistent basis.
- Flexible data systems: A CRIS will be more successful if the data are presented in a clear format, are pushed out to the intended user (instead of requiring the user to access one or more data systems to “pull” the data), and can be easily manipulated by the end user, for example, to examine student subgroups. The data infrastructure that schools use to implement their CRIS, which includes the hardware, software, and technical expertise of the IT department, may not be flexible enough to support how districts intend to use indicator data.
- Indicator selection: Districts may be interested in selecting indicators that they find meaningful to their local context or priorities, but do not appear on the CRIS menu. If that is the case, we encourage them to develop a plan to test the empirical relationship between their new indicator and CR, while simultaneously using a parallel indicator from the CRIS menu.
The first two years of the CRIS initiative have shown us that districts are increasingly concerned with CR and are re-evaluating existing practices and developing new ones to promote college access and success for more students. The issues discussed above shed light on the conditions that need to be in place for the successful implementation of a CRIS. Districts will develop a stronger CRIS if the indicators align with their strategic plans and internal capacity. Ultimately, ,collecting more data will not lead to better outcomes for youth unless a system is in place that helps turn those data into meaningful action. In the final year of the CRIS project, the JGC will continue to assist districts’ COI development, validation of CR indicators, and efforts to track the effectiveness of supports and interventions. We will also pursue implementation research on the effective use of indicators with the goal of producing a set of CRIS-related tools for the wider field.
1. For more about the CRIS initiative, a partnership between the John W. Gardner Center for Youth and Their Communities and the Annenberg Institute for School Reform funded by the Bill & Melinda Gates Foundation, visit the project page online.
2. For more information on leading indicators, see the Annenberg Institute for School Reform report Beyond Test Scores: Leading Indicators for Education.
Allensworth, E. M., and J. Q Easton. 2007. What Matters for Staying On-Track and Graduating in Chicago Public High Schools: A Close Look at Course Grades, Failures, and Attendance in the Grade 9 Year. Chicago, IL: University of Chicago, Consortium on Chicago School Research.
Bill & Melinda Gates Foundation. 2010. Student Perceptions and the Measures of Effective Teaching Project. Seattle, WA: Bill & Melinda Gates Foundation.
Conley, D. T. 2007. Redefining College Readiness. Eugene, OR: Educational Policy Improvement Center.
John W. Gardner Center for Youth and Their Communities. 2011. “College Readiness Indicator Systems (CRIS) Toolkit.” Interim product (November). Stanford, CA: Stanford University, JGC.
Pascarella, E. T., C. T. Pierson, G. C. Wolniak, and P. T. Terenzini. 2004. “First-Generation College Students: Additional Evidence on College Experiences and Outcomes,” Journal of Higher Education 75, no. 3:249–284.
Perna, L. W. 2004. Impact of Student Aid Program Design, Operations, and Marketing on the Formation of Family College-Going Plans and Resulting College-Going Behaviors of Potential Students. Boston, MA: The Education Resources Institute.
Turner, S. 2004. “Going to College and Finishing College: Explaining Different Educational Outcomes.” In College Choices: The Economics of Where to Go, When to Go, and How to Pay for It, edited by C. M. Hoxby. Chicago, IL: University of Chicago Press.
